
- August 19 → GitHub Changelog — GitHub published the organization code quality Trends feature.
- August 19 → GitHub Community Discussion — Caro Galvin responded to early user feedback on the launch day.
Caro Galvin told teams in the August 19 community discussion that the new Trends tab gives engineering leads a movement line across every repository, not just a point-in-time snapshot of open findings. “Product-level budget is on our roadmap, in the meantime you should be able to create a SKU-level budget to control the AIC spend for CQ,” she replied when a user asked about cost controls. She also confirmed a bug blocking some public repos from enabling the feature, adding that it was “high on our post-release fix list.”
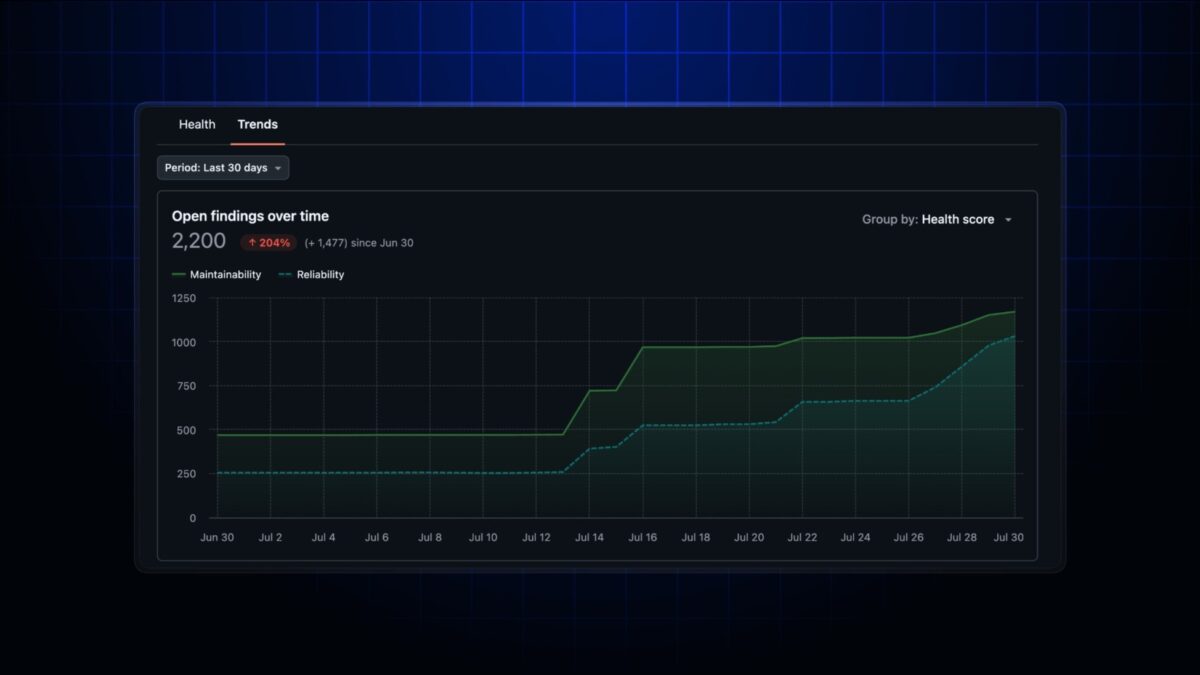
Allison announced the change on the GitHub Changelog on August 19, noting that the dashboard previously showed only a point-in-time snapshot and that the new Trends tab replaces that still frame with direction — whether findings are climbing, falling, or holding steady.
What the Trends tab actually shows
The trend graph plots open findings across 7, 14, or 30 days, grouped by health score or severity GitHub Code Quality docs. Beside the line, teams see their current total open findings and the net change since the period began. Two tables rank repositories by how much their open findings moved, surfacing the most improved and the ones quietly accumulating debt.
Who gets it — and who doesn’t
The rollout is narrower than the dashboard implies, however. Organization-level quality trends are available only on GitHub Enterprise Cloud and GitHub Team plans with Code Quality enabled, plus GitHub Enterprise Cloud with data residency GitHub data residency docs. It does not reach GitHub Enterprise Server.
GitHub’s broader push into quality signals tied to Copilot is covered in our report on Microsoft’s MAI-Code-1.1-Flash landing in GitHub Copilot zBrandco.
A graph shows direction, not cause. A rising finding count tells a platform lead where to look, but not why a module degraded. The trend tab is a smoke alarm, not a diagnosis.
The harder question is whether a monthly trend line can keep pace with code that ships every hour — and whether teams will actually watch it.