
An analyst who can write the SQL to flag suspicious transactions still needs a way to turn that logic into a model, and classic ML tooling expects Python. Amazon’s Part 2 walkthrough removes that blocker by pointing SageMaker Canvas straight at a Snowflake warehouse, so the person who knows the fraud patterns is also the person who builds the model.
The payoff is a fraud detector you can retrain from the same console where the data already lives, without a hand-off to a data science team.
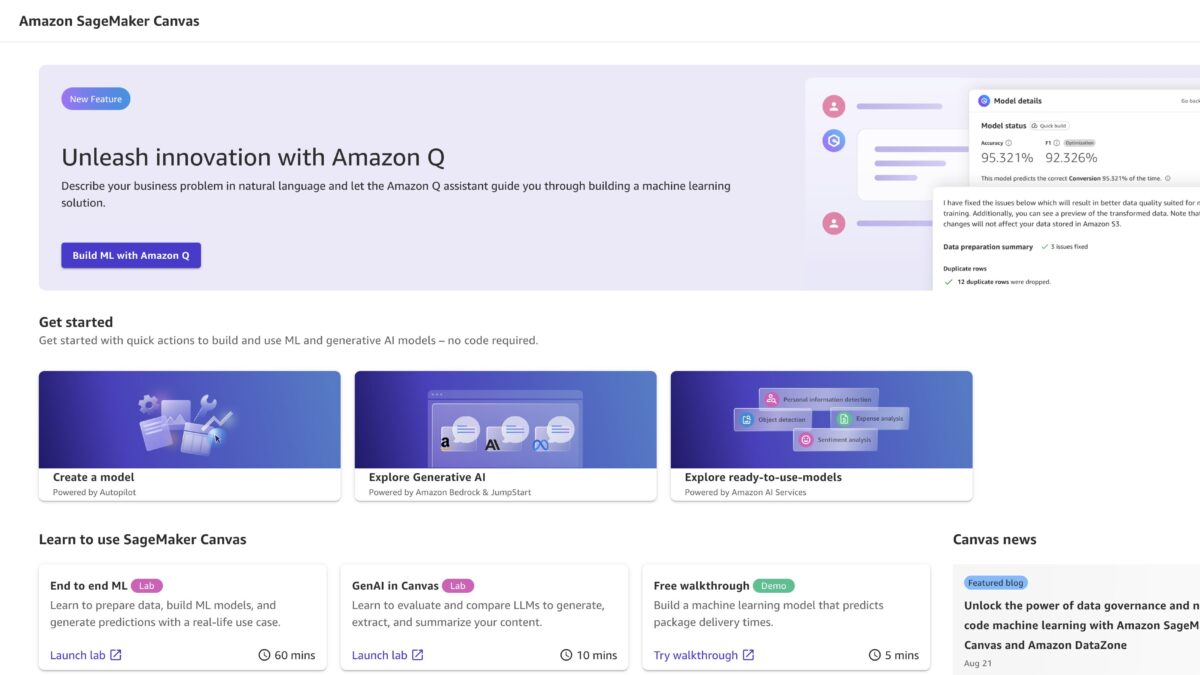
SageMaker Canvas is Amazon’s visual, no-code machine learning service. It gives business analysts a point-and-click path from raw data to predictions, with governance and storage handled by the underlying SageMaker domain.
This guide follows Part 2 of Amazon’s two-part series, which picks up after Part 1 provisions the Snowflake environment and shows the full data-prep-and-train flow AWS Machine Learning blog.
Stand up the SageMaker domain and Snowflake link
The Canvas steps assume the Snowflake half of the project already exists. Complete Part 1 first: a Snowflake account, a database, and a table of transaction history the walkthrough queries against. You also need the credentials Canvas will use to connect — the account identifier, a username, and a password.
The sample fraud table the walkthrough queries carries columns such as the card number, merchant, category, amount, transaction timestamp, state, gender, date of birth, and the fraud label. Knowing those names helps you read the queries in the next steps and confirm the join key lines up before you build anything.
The Account ID field in the Canvas connection dialog expects two pieces joined by a hyphen: your Snowflake organization name, then the account ID. Getting this string wrong is the most common reason a first connection fails, so copy it from the Snowflake console rather than guessing. Keep the username and password from Part 1 handy before you open Canvas.
Canvas runs inside a SageMaker domain, so create one next. In the SageMaker AI console, open the left navigation pane, choose Domains under Admin configurations, and select Create domain SageMaker quick setup. The single-user Quick setup option builds the domain and a user profile for you automatically.
Quick setup also attaches the permissions Canvas needs. The new domain execution role receives the SageMakerFullAccess, SageMakerCanvasFullAccess, and SageMakerCanvasAIServicesAccess policies, so a business analyst can open Canvas without a separate IAM request SageMaker quick setup. With the domain in place, open Canvas from the left pane and pick the domain and user profile you created.
Wait three to five minutes for the workspace to load AWS Machine Learning blog.
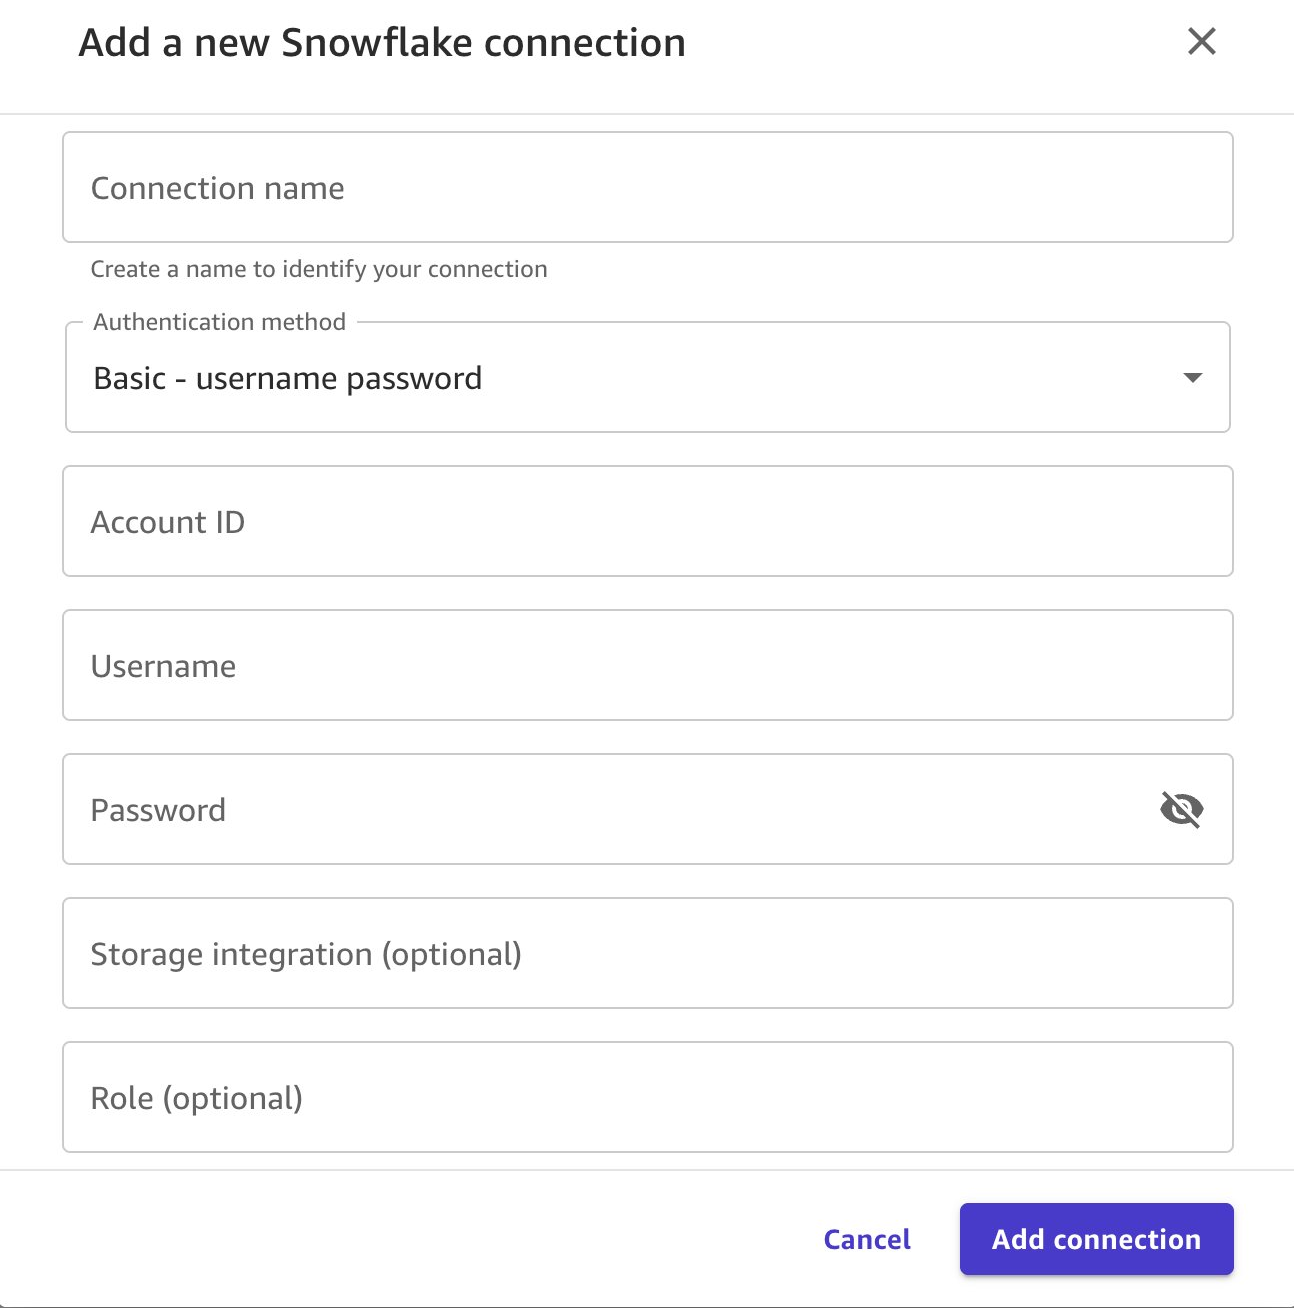
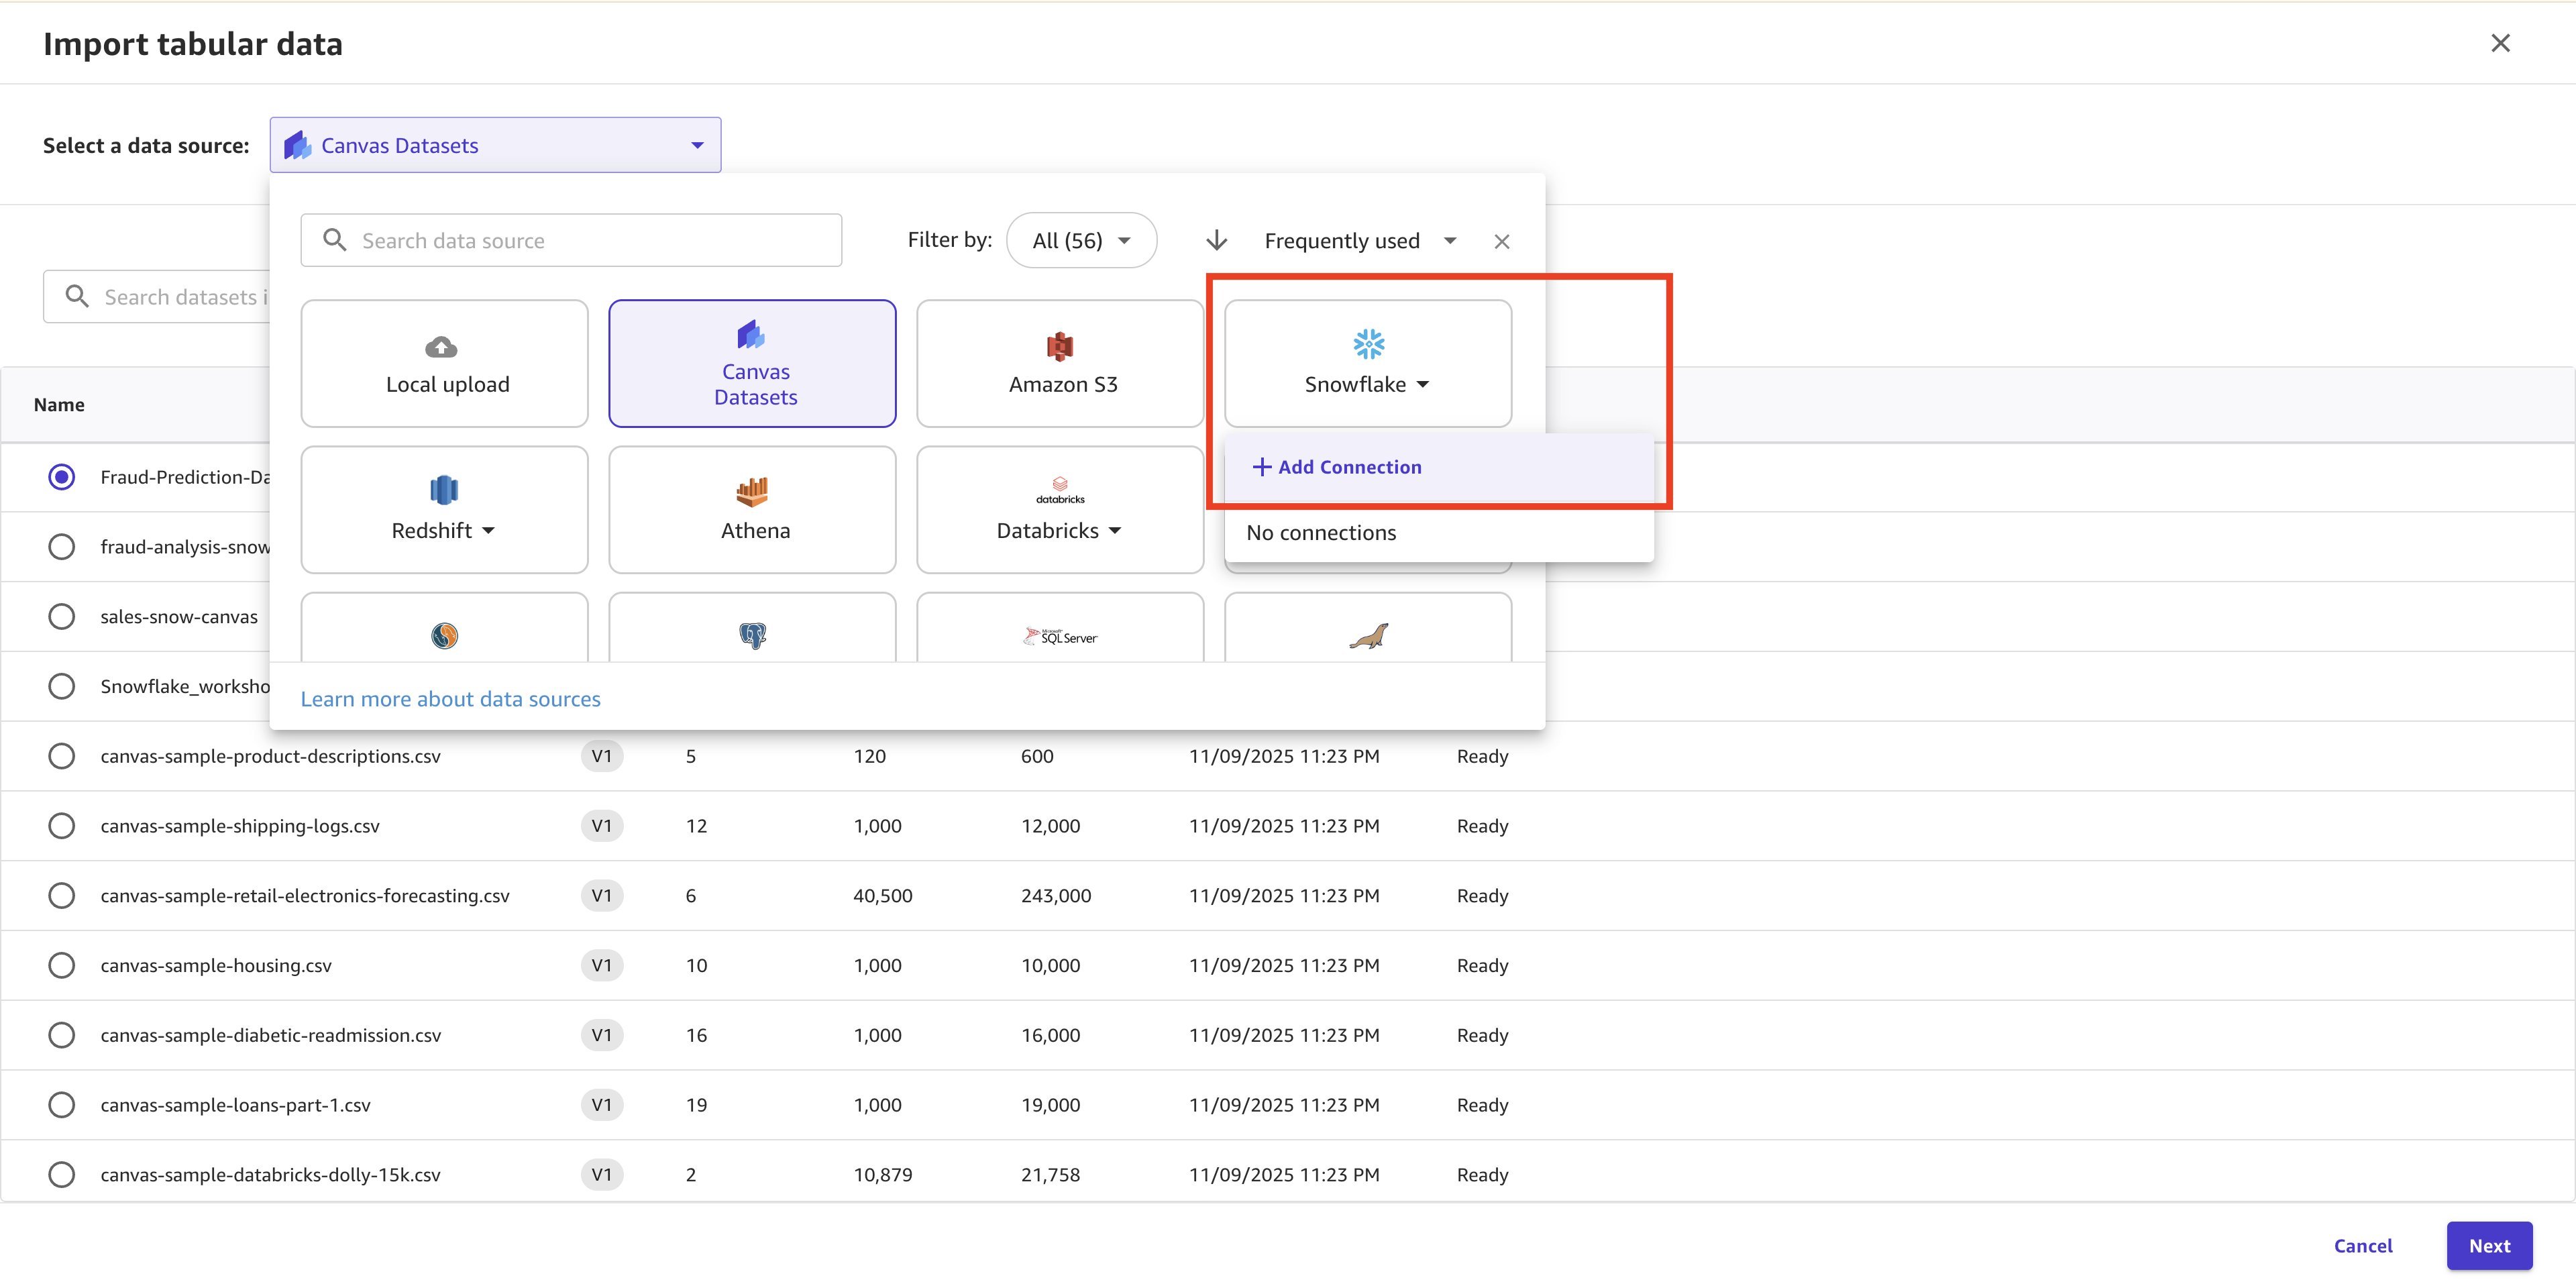
Then choose Data Wrangler, pick Import and prepare, select Tabular, and set the data source to Snowflake. Add the connection with your Account ID, username, and password; Canvas reaches the warehouse directly instead of exporting flat files.
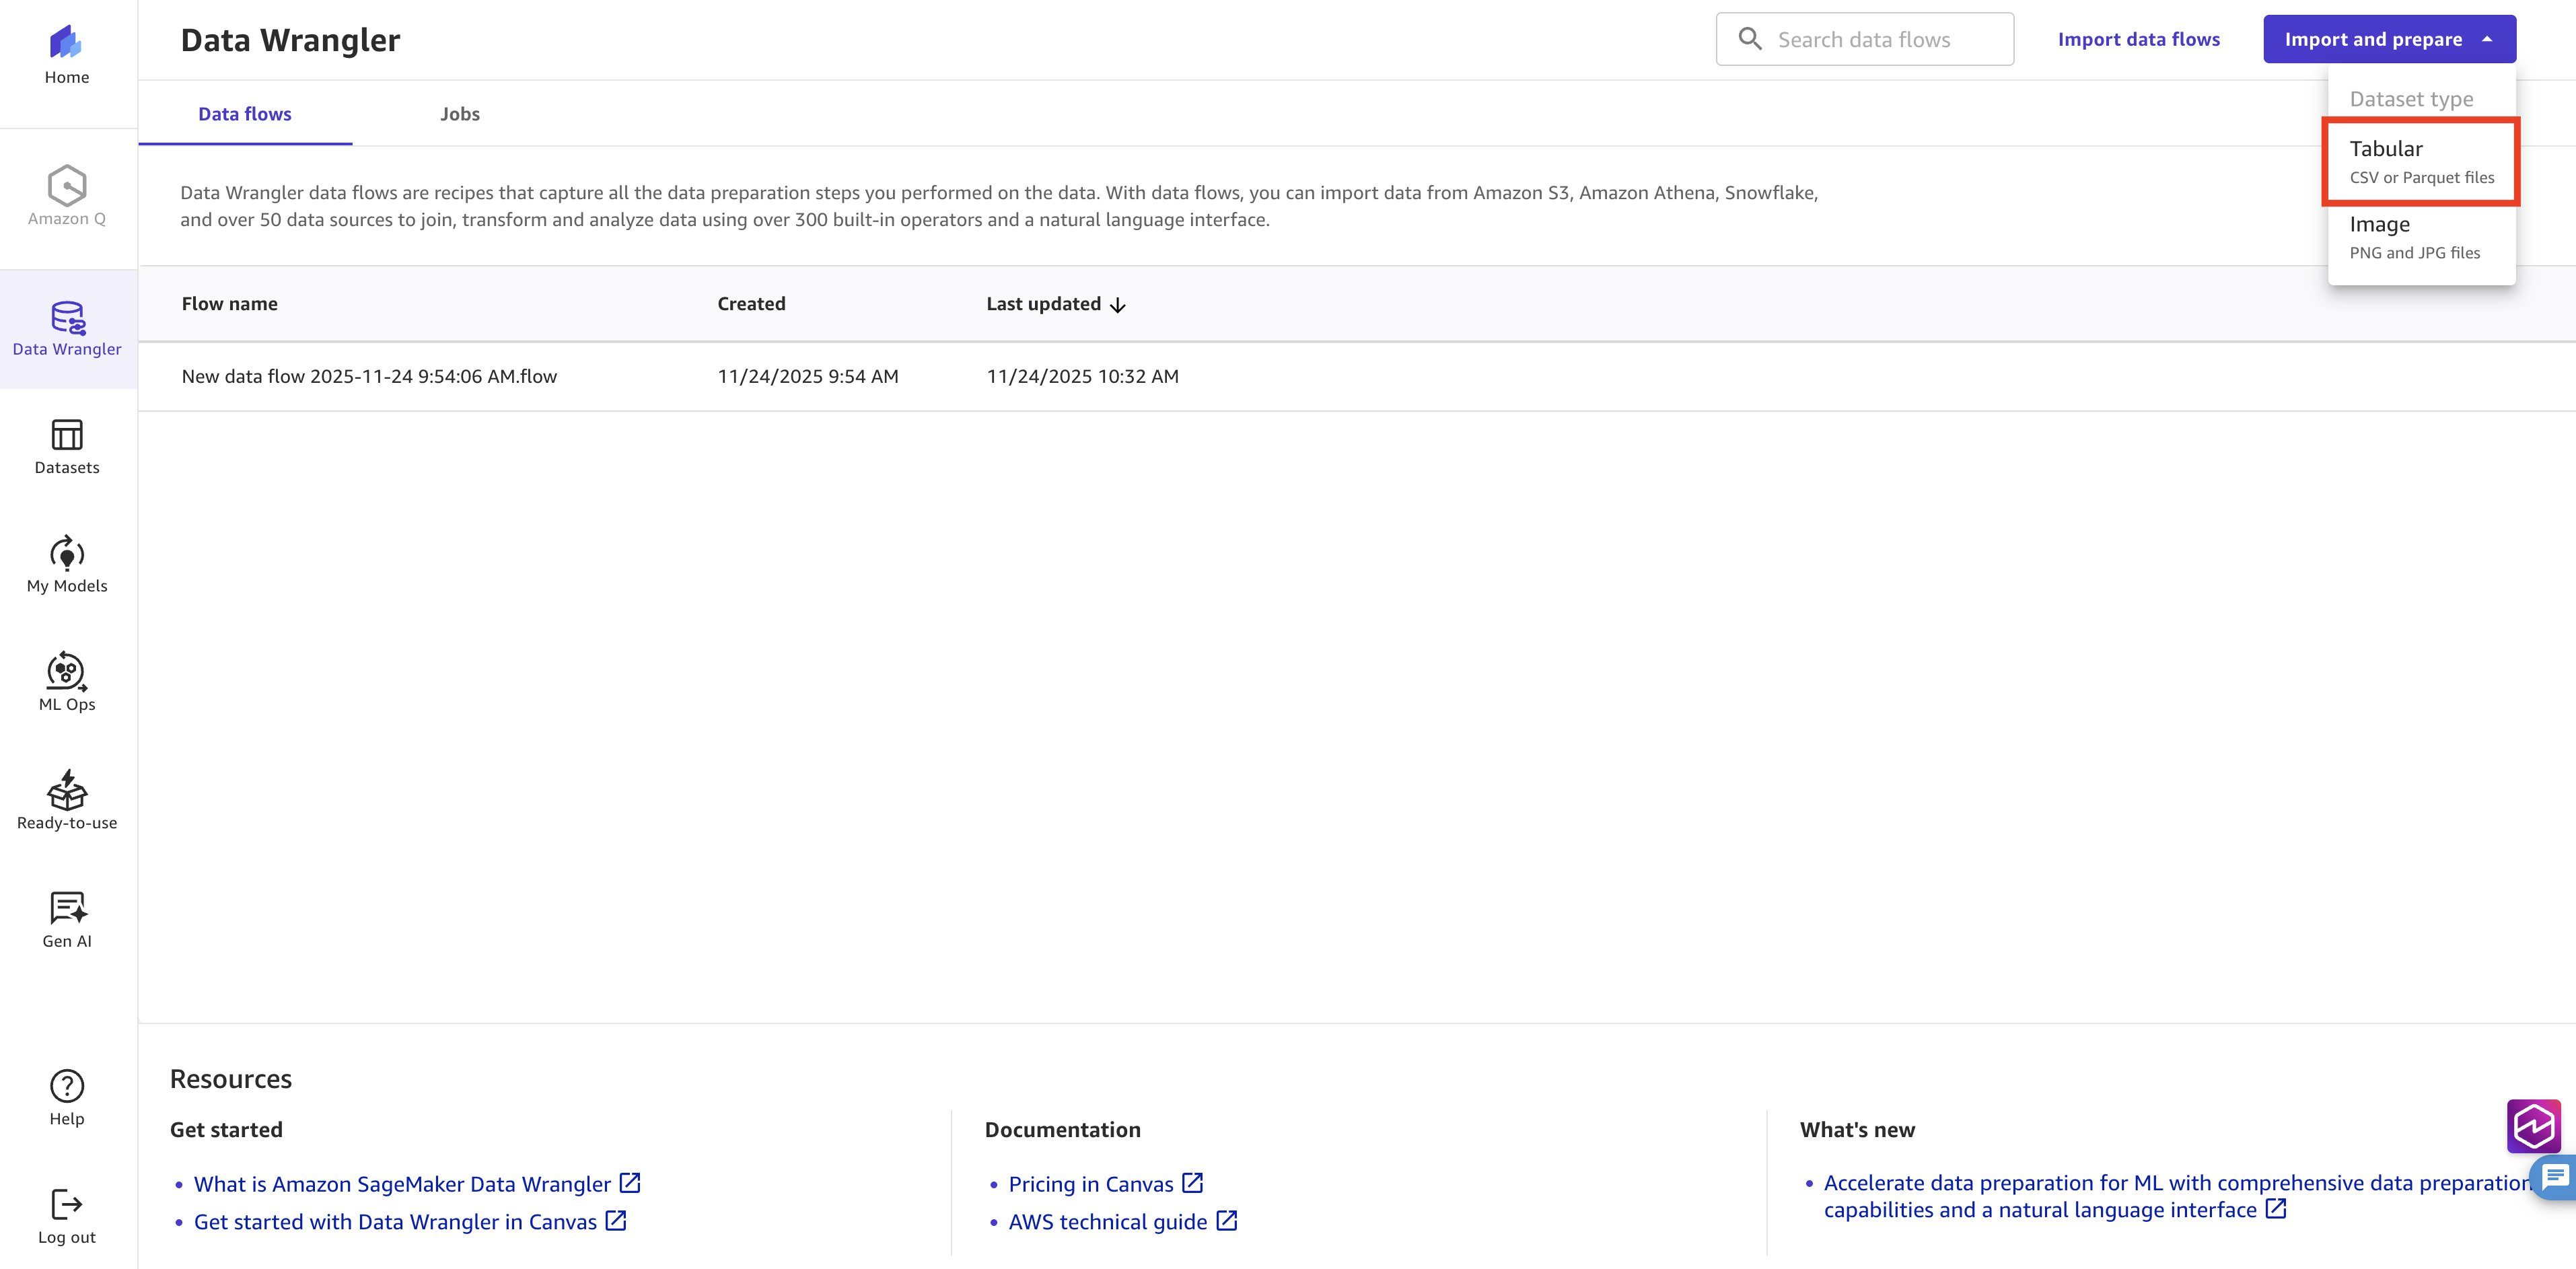
Source: AWS Machine Learning blog
Pull the fraud outlier threshold with SQL
Data Wrangler lets you pull the exact rows you need with SQL instead of exporting a flat file. The walkthrough builds an outlier threshold by grouping on card and category, then adds a card-level flag when an amount exceeds the average plus a set number of standard deviations. Run the query, preview the result, and import it into the Canvas workspace so the cleaning happens where the data already lives.
The first query also folds in a simple fraud-history signal: it marks a card as historically suspicious when several past transactions were labeled fraud. That column later becomes a feature the model can weigh, though you will deselect it at training time to avoid leaking the answer into the inputs.
The result set carries two engineered values per card and category: an amount outlier bound and a fraud-history flag. Preview the rows in the SQL editor before you import, because a typo in the grouping clause produces a threshold that hides real outliers. Importing only after the preview looks right keeps the rest of the flow honest.
Because the threshold query groups by card and category, a brand-new card with no history gets no bound and falls through to the default rules. That is expected; the model still learns from the merchant and temporal features for first-seen cards, so a missing bound is not a reason to abandon the row.
Enrich with transaction and merchant features
A second Snowflake query adds the signals a fraud model actually needs: hour of day, day of week, age band, and merchant-level outlier thresholds. Import that as a second tabular source, then join the two datasets on Category with a left outer join so every transaction keeps its enrichment features. Mixing temporal and merchant signals is what separates a model that catches novel fraud from one that only memorizes past charges.
The age band is bucketed into age bands so the feature stays stable without overfitting to exact ages. Merchant-level thresholds catch outlets whose typical ticket size sits far from the norm, a useful hint that a charge may be unusual for that store even when the amount looks ordinary in isolation.
In the Data flow canvas, choose Add Data and pick Tabular to bring in the second source through the same Snowflake connection. Paste the enrichment query, run it, and import the result. Keep the two queries in separate flow nodes rather than one wide query; Canvas shows each as its own step, which makes the join and the later transforms easier to read and to debug.
Join the sources and engineer flags
On the Data flow screen, choose the plus icon next to the first source and pick Combine data, then Join. Set the join type to Left outer join and use Category as the key on both sides, then preview the merged rows before you add the step. A correct preview means every transaction now carries its enrichment columns alongside the outlier flags.
Add a Custom Formula transform that sets CC_FLAG to true when the amount beats the card outlier, and MERCHANT_AMT_FLAG when it beats the merchant outlier. Then use Manage Columns to drop CC_NUM, AMT_OUTLIER, MERCHANT, and MERCHANT_AMT_OUTLIER so the model never trains on raw card numbers or amounts. Dropping the raw identifiers also keeps the project inside typical governance rules for handling payment data.
Source: AWS Machine Learning blog
Source: AWS Machine Learning blog
Run a data quality and insights report
Before training, run the Data Quality and Insights Report with IS_FRAUD as the target and Classification as the problem type Data Wrangler data insights. The report surfaces missing values, outliers, class imbalance, and target leakage so you can fix issues while they are still cheap to fix, rather than discovering them after a complete build.
The sampled option inspects the first 50,000 rows of the dataset, which is enough to spot leakage or imbalance without scanning everything Data Wrangler data insights. The Quick model block prints accuracy and a confusion matrix you can use as a sanity check on the feature work you just did. A warning about target leakage here beats the same surprise after a full training run.
The feature summary section ranks each column by prediction power. If a column you expected to matter ranks near zero, consider dropping it; if a column you meant to exclude still ranks high, suspect leakage and re-check the join. The report also lists duplicate rows and anomalous samples, which are worth a look before you commit compute to a build.
Export and train the XGBoost model
From the final transform node, choose Create model and export the prepared dataset. Set IS_FRAUD as the target, pick a 2-category model, and select Ensemble with the XGBoost algorithm.
A Standard build takes roughly 15 to 30 minutes AWS Machine Learning blog. Deselect the FRAUD_HISTORY and MERCHANT_FRAUD_HISTORY columns first so prior labels do not leak into the features. When the build finishes, open the Analyze tab to see which columns drove the predictions.
The walkthrough picks the ensemble method with XGBoost because it balances accuracy with training efficiency on a tabular fraud set. A single algorithm can work, but the ensemble tends to steady the recall on the rare fraud class, which is the metric that matters when most rows are legitimate.
The Analyze tab shows feature impact, a scatterplot of predictions, and an Advanced Metrics view with precision and recall for the fraud class. A high overall accuracy can still hide weak fraud recall, so check the fraud row of the confusion matrix before you trust the model on real charges. Feature impact tells you whether the merchant and temporal signals actually carried the prediction, or whether the model leaned on a leaky column.
Score new data and push to QuickSight
With the model trained, open the Predict tab and choose Manual to create a dataset from a held-out CSV. Upload the file, preview it, and create the dataset; then select it and generate predictions. The job takes a few minutes, and you wait until the status reads Ready before downloading the scored rows.
Canvas offers a sample prediction CSV you can download to practice the Predict flow before pointing it at production data. Run it once to learn the column mapping, then swap in your own held-out file so the first real score is not also the first time you have seen the output shape.
To chart results in Amazon QuickSight, your QuickSight account must share the SageMaker Canvas domain’s AWS Region, and the domain’s execution role needs extra permissions to send predictions onward. QuickSight then turns the prediction column into a dashboard the same fraud team already uses. Skipping the region check is the usual reason predictions never appear in the dashboard.
Troubleshoot the common failure points
A connection that will not authenticate almost always traces back to the Account ID string or stale Part 1 credentials, so re-copy both from Snowflake before blaming Canvas. If the join preview shows null enrichment columns, the Category key values do not match between the two queries — fix the SQL, not the join. When the insights report flags heavy class imbalance, gather more fraud examples or accept that the model will favor the majority class.
If a Standard build fails or times out, confirm you deselected the history columns and that the dataset exported fully from the data flow. A build that finishes but shows poor fraud recall usually means a leaked or constant feature slipped through; rerun the insights report and drop the offending column. These checks turn a stuck run into a shippable model without ever leaving Canvas.
If QuickSight stays empty after a successful prediction job, the two likely causes are a Region mismatch and a missing execution-role permission. Confirm both before opening a support ticket, because the prediction data is almost certainly fine and simply not allowed to cross the boundary into the dashboard.
The flow ends with a trained, no-code fraud model that an analyst — not a data scientist — can rerun whenever the Snowflake data changes. SageMaker Canvas is one of several no-code paths on AWS; Amazon also ships pretrained models through SageMaker JumpStart zbrandco.com, and teams deploying automated pipelines can also build Bedrock document classifier agents for related cloud workflows. The real win is that the warehouse and the model now sit inside the same clickable workspace.