
Amsterdam’s Van Gogh Museum sits on a data set most tech companies would envy: a multimedia guide in visitors’ hands that records which paintings they visit, in what order, and how long they linger. For years, that information mostly sat unused. Then the museum handed a slice of it to a team of business-school researchers — and what came back is one of the clearest demonstrations yet of how cultural institutions can run on data without turning into optimization machines.
The findings, reported by Ars Technica on July 25, come from a study by Ali Aouad of MIT’s Sloan School of Management, Abhishek Deshmane of Georgia Tech’s Scheller College of Business, and Victor Martínez de Albéniz of IESE Business School, published in the April 2026 print issue of Management Science. It’s a use case worth studying closely, because the museum sector has historically collected this kind of data and then ignored it — a “gold mine,” in Deshmane’s words, left unmined.
The setup: 25,000 visits, one model
The researchers randomly selected 25,000 out of 1.5 million visits to the Van Gogh Museum between 2019 and 2021. From each visit they extracted the visitor’s interactions with the museum’s digital multimedia guide, then combined that with the physical location and artistic characteristics of the works on display. The museum’s collection holds more than 4,600 works, of which roughly 200 are shown at any given time — so where each piece hangs, and how the guide sequences them, are genuine editorial decisions.
Their model, called pathway multinomial logit — “pathway MNL” — treats every step of a visit as a choice. At each moment, a visitor can view another painting, change floors, or simply leave, and each option carries a perceived benefit that gets weighed, likely subconsciously. Trained on the guide data, the model predicted transitions between artworks with 63 percent accuracy on held-out data, whether a visitor would reach a specific piece with 81 percent accuracy, and departure rates with 96 percent accuracy. The authors caution that the model doesn’t establish causal effects, but the associations were strong enough to act on.
What the data actually revealed
Some of the findings confirm curatorial instinct; others cut against it.
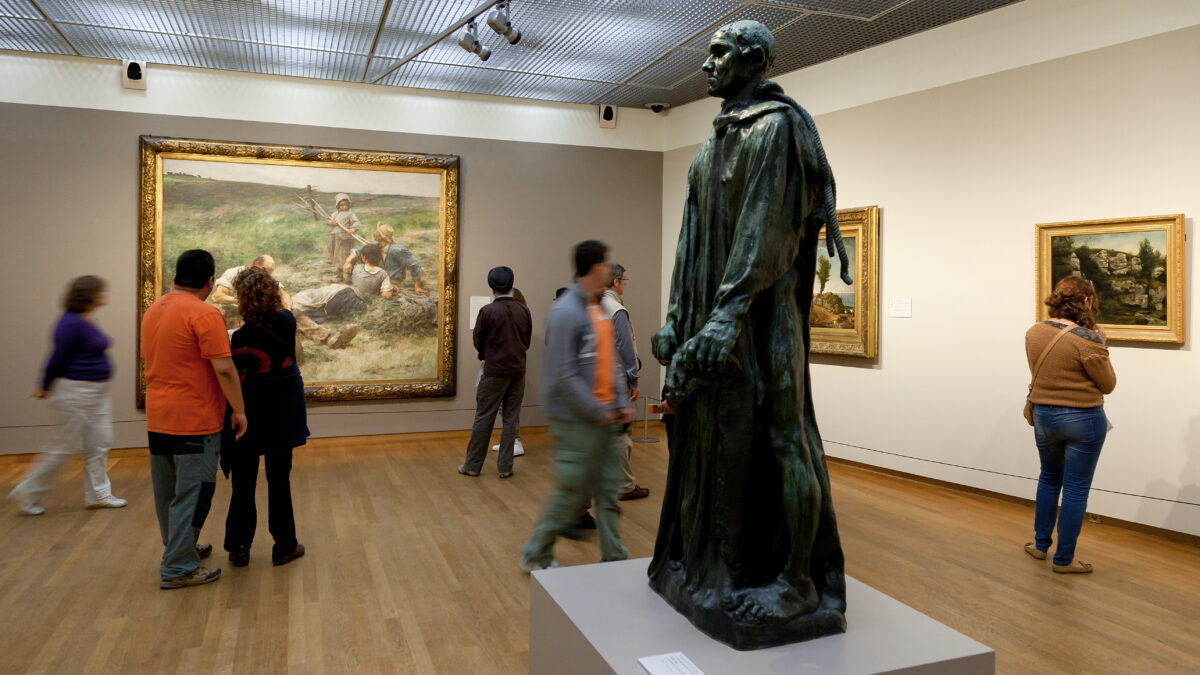
Visitors sought variety in time period and size, but consistency in subject and theme — they’d happily jump between decades, but preferred to stay on a narrative thread. Time pressure changed behavior: as a visit wore on, people increasingly prioritized the masterpieces, skipping the deep cuts. And in the study’s most counterintuitive result, congestion can increase engagement. “When there are more people, at least up to a certain number… people are more likely to go and view artworks that they probably wouldn’t have seen,” Deshmane said. A crowd around a painting acts as a quality signal.
The guide itself turned out to wield real influence. Multimedia guide users largely visited recommended artworks in the suggested order, and even subtle ordering changes on the guide shifted physical traffic patterns through the building. “We actually have a lot of power in how we move people through,” said Lisa van den Bos, who was the museum’s product manager for digital education while the study ran.
Rather than physically rearranging the galleries to test ideas, the team ran simulations. Those suggested that moving highly attractive works away from “leaky spots” — locations near stairs and lifts where visitors drift off — and strategically swapping pieces could get visitors to see more art and stay longer, without compromising curatorial intent. Even redesigning the digital guide’s sequence alone, with no physical moves at all, could help visitors encounter work through new perspectives, according to Gundy van Dijk, the museum’s head of education and interpretation.
Why most museums haven’t done this
The strange part of this use case is not that it worked — it’s that it’s rare. Audio guides have been around since at least the 1950s, and modern multimedia versions log detailed interaction data by default. Content designers like Sandy Goldberg, who writes for museums including the Van Gogh, describe a “pendulum swing” back toward audio after waves of flashier interactive tech: study after study found visitors wanted an “in-the-pocket” experience — a device they could stash and stop thinking about. Yet according to Sietze de Jong, creative and managing director of Tapart, the agency that maintained the Van Gogh Museum’s guide software during the study, museums almost never look at what they collect: “Every museum requests us to do analytics and include it in their audio guide… but when we ask them if they reviewed the data, they almost never have.”
The bottleneck is institutional capacity, not technology. That is starting to shift — digital teams are growing, and trustees, funders, and governments increasingly expect strategic decisions to be grounded in measurable evidence. The Van Gogh Museum is ahead of the pack on adoption, too: throughout 2023, 36 percent of its average 4,600 daily visitors booked multimedia guides, up from the 25–31 percent typical during the study period, while sector-wide uptake for paid tours hovered closer to 10 percent.
The collaboration also fed directly into product decisions. In 2025, the museum rolled out a redesigned multimedia tour — with hardware powered by Samsung Galaxy S25 devices and software from NOUS Digital — whose design drew on the research team’s findings about how visitors actually use digital guides. A follow-on study between 2022 and 2024 went further, experimentally varying what the guide offered visitors to test digital nudges against fatigue and information overload.
The uncomfortable question: should museums steer taste?
Once you know that visitors follow recommendations, the next question is what to recommend — and that’s where this use case gets philosophically interesting.
The temptation is to borrow the streaming-service playbook: predict what people like, then serve more of it. The museum professionals in the Ars report push back on that almost unanimously. “Showing people artworks that you think they’re going to like actually is a disservice,” said Hilary Knight, director of Change& in London and former director of digital at Tate. “One of the roles of art is to challenge you and to present you with things that you might not like or might not realize you like.” Knight also warns of recommendations becoming self-perpetuating — “reinforcing the canon” of famous works that already occupy the best wall space and draw the biggest crowds.
Deshmane’s proposed middle path is an “assortment” of suggestions: sets of options organized by how much time a visitor has, or by narrative threads, ranging from a subtle reordering on the guide to an explicit push notification. “You as a museum can do a lot more with one physical layout… if you have these digital assortments of layouts,” he said. The museum’s own staff frame the limit clearly: over-personalizing can create a sense of loss. “You have to make choices [such] that people don’t feel like they’re missing a lot if they’re choosing,” said Rianne van Dam, project coordinator for digital education at the Van Gogh Museum.
Beyond Amsterdam: the wider pattern
The Van Gogh Museum is the deepest example, but not an isolated one. At MUNCH in Oslo, the museum dedicated to Edvard Munch, the New Snow exhibition ran in two waves across 2024 and 2025 and let visitors draw their own images, which were then matched to the closest sketch among Munch’s own drawings — works too fragile to display often. More than 70,000 visitor drawings came out of the project. “If we can’t engage and create museum experiences that are both physical and virtual in a way that the next generation of users find engaging, then we’re not going to be a museum in the future,” said Birgitte Aga, MUNCH’s head of innovation and research.
Elsewhere, machine learning is being applied to collections databases, visitor surveys, and operational data, and to generating textual descriptions of artworks for accessibility, according to Elena Villaespesa, head of digital analytics at the Thyssen-Bornemisza National Museum in Madrid. But the sector is treading carefully around generative AI — experiments in “speaking to” artists exist, but institutions are shying away from letting AI play a curatorial role, citing accuracy and artistic integrity.
The takeaway for anyone running a physical space
Strip away the paintings and this is a case study in instrumenting a physical experience with data you already collect. Three lessons travel well beyond museums:
- The data is probably already there. The Van Gogh study used existing guide logs, not new sensors. The gap was analysis, not collection.
- Sequence is a lever. The order in which a digital companion presents options measurably changes how people move through physical space — a finding the authors note applies to entertainment, education, and retail settings that blend physical and digital.
- Optimize for the mission, not the metric. Every practitioner interviewed converged on the same guardrail: use the model to serve the story, not to flatter existing preferences.
Or as van den Bos put it: museums “will always be a place where the story is leading and the creativity is leading.” The data just tells you whether the story is landing.