
As engineering organizations move from experimental AI coding pilots to broad team adoption, the operational question shifts from whether developers are using the tool to whether leadership can measure adoption, manage consumption, and maintain governance. OpenAI Codex, when configured to use Amazon Bedrock as its model provider, can emit OpenTelemetry (OTel) metrics from each developer’s local workstation. By routing those metrics through a per-workstation collector to Amazon CloudWatch, teams gain a unified view of usage organized by user, team, department, or cost center, without inserting a centralized proxy between the developer and the model source.
This guide covers the five implementation stages from the AWS reference pattern, the required AWS permissions, the Codex configuration changes, validation steps, governance trade-offs, and an alternative gateway pattern for teams that need hard budget controls.
What you need before starting
The reference pattern requires an AWS account with Amazon Bedrock access, IAM Identity Center enabled for organizational identity, and the Codex CLI already configured to route requests through Bedrock. You also need administrative access to enable CloudWatch OTel ingestion in the target Region, plus the AWS CLI installed and authenticated locally. The Codex configuration file lives at ~/.codex/config.toml by default, and you can override individual keys from the command line using -c or --config flags for one-off testing source.
Codex supports named configuration layers through the --profile flag. When you pass --profile profile-name, Codex loads ~/.codex/config.toml, then overlays ~/.codex/profile-name.config.toml. Profile files contain only the values that differ from the base configuration, which makes them a clean way to switch between environments without duplicating the entire settings file source.
Step 1: Enable CloudWatch OTel capabilities
The first stage turns on account-level OTel enrichment and resource-tagging in the Region where you plan to ingest metrics. The reference runbook uses three commands:
aws cloudwatch start-otel-enrichment --region us-west-2
aws observabilityadmin start-telemetry-enrichment --region us-west-2
aws cloudwatch get-otel-enrichment --region us-west-2
The start-otel-enrichment operation enables OTel enrichment and PromQL querying for supported AWS vended metrics, while start-telemetry-enrichment enables resource-tag enrichment source. Confirm which account-level settings are already active before changing them, because these features can support other CloudWatch observability workloads in the same account.
Step 2: Deploy the dashboard and build the collector
The second stage deploys a pre-built CloudWatch dashboard and builds the local collector binary that will run on each developer workstation. The deployment scripts are packaged in the reference repository:
deployment/scripts/deploy-otel-stack.sh --region us-west-2
deployment/scripts/build-local-collector.sh --all
The CloudFormation stack creates the CodexOnBedrock dashboard. Notably, this step does not provision centralized collector compute, a load balancer, a VPC, or a public ingestion endpoint; the collector remains entirely on the developer machine source.
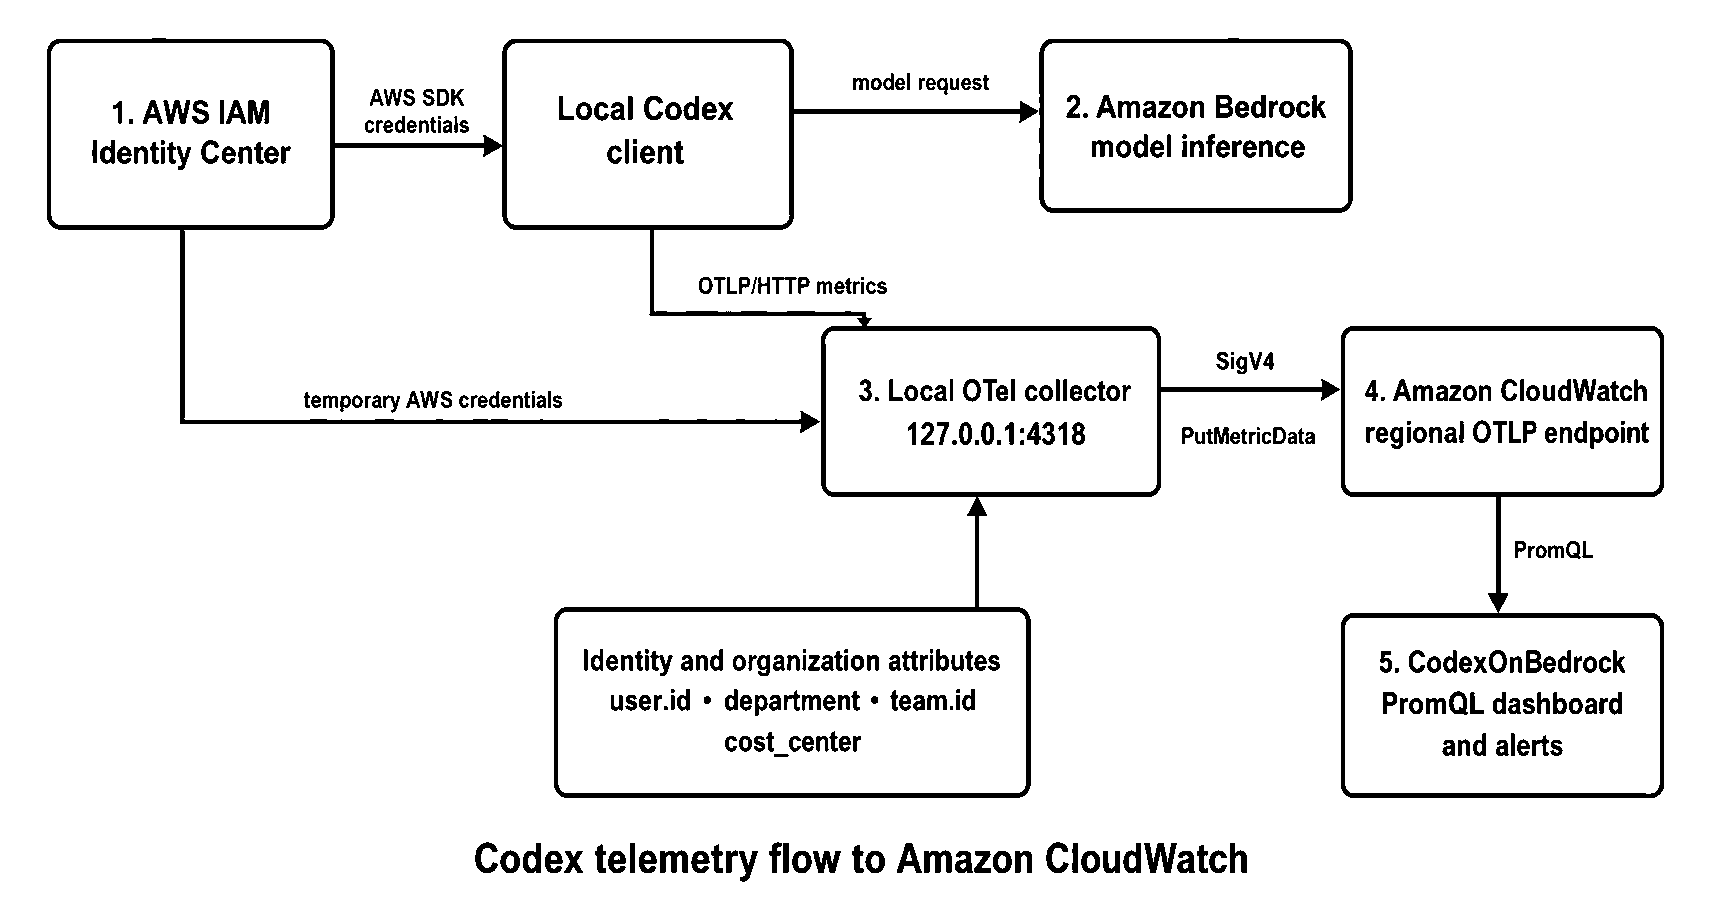
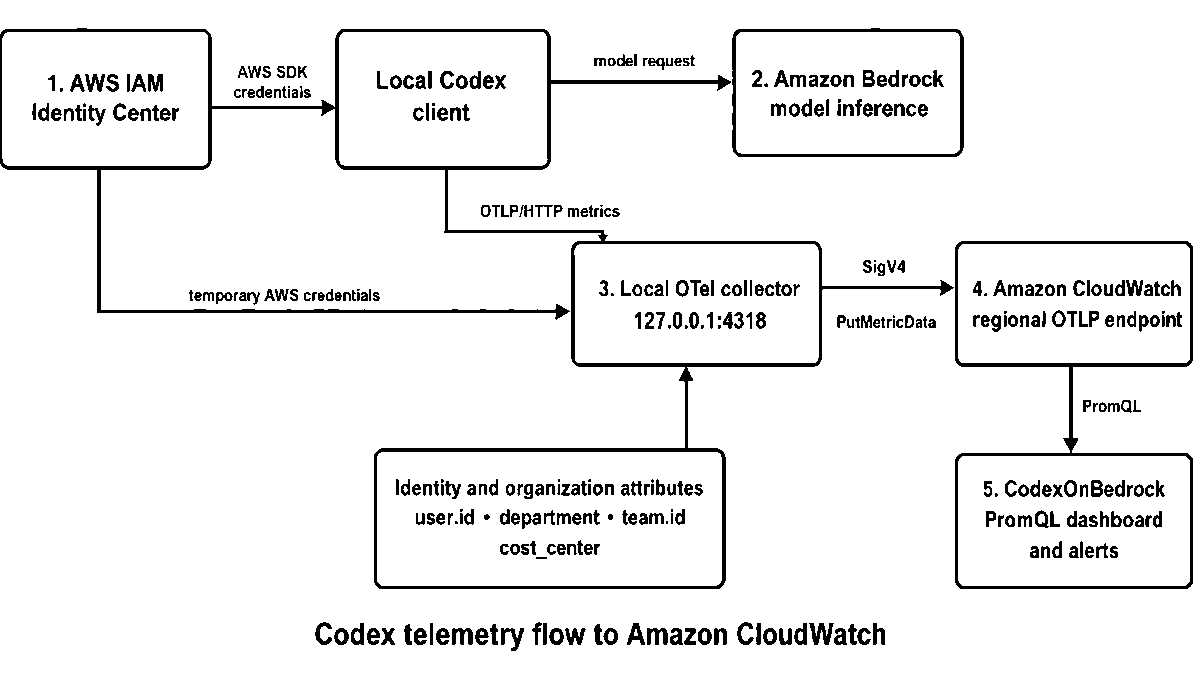
The diagram above illustrates the local-only path: Codex emits metrics on 127.0.0.1, the collector enriches them with organizational attributes, and SigV4-signed requests reach the regional CloudWatch OTLP endpoint. Because the collector runs as a sidecar on the same host, there is no additional network hop in the model-request path.
Step 3: Generate per-developer configuration
The third stage generates the collector configuration from the developer’s authenticated AWS profile. The reference script reads organizational attributes from IAM Identity Center when you pass the --auto-lookup flag:
deployment/scripts/generate-sidecar-config.sh \
  --region us-west-2 \
  --profile codex-bedrock \
  --auto-lookup
With --auto-lookup, the script pulls attributes such as department, team ID, cost center, organization, location, role, and manager from the identity store source. Explicit command-line values override discovered attributes when needed. If an optional attribute is unavailable, omit its entire configuration block; do not send placeholder strings as dimensions, because they create low-value series and weaken reporting quality.
For fleet rollouts, distribute this configuration through your existing endpoint-management process and treat organizational metadata as governed data. Establish approved values, ownership, and update procedures before using these dimensions for executive reporting.
Step 4: Configure Codex and grant least-privilege access
The fourth stage points the Codex metrics exporter to the local collector and ensures the publishing identity has the minimum required IAM permission. In the Codex configuration file, add:
[otel]
environment = "production"
log_user_prompt = false

[otel.metrics_exporter]
otlp-http = { endpoint = "http://127.0.0.1:4318/v1/metrics", protocol = "binary" }
Include the full /v1/metrics path because Codex does not append it automatically source. The collector forwards metrics to the regional CloudWatch OTLP endpoint, such as https://monitoring.us-west-2.amazonaws.com/v1/metrics, using SigV4 authentication with temporary AWS credentials.
The IAM policy for the publishing identity needs only cloudwatch:PutMetricData. No log-group or ECS permissions are required for this metrics path. Keep log_user_prompt = false; the design is intended to capture operational and adoption signals, not prompt content or source code.
Step 5: Validate the complete flow
The final stage confirms that metrics are arriving in CloudWatch. Start the service-specific collector with the generated configuration, run any Codex task, and open the CodexOnBedrock dashboard in the CloudWatch console. You can also run the repository’s check-otel-pipeline.sh script or use CloudWatch Query Studio to verify that codex.turn.token_usage is present source.
Codex flushes metrics periodically and on a clean process exit. The reference runbook documents a 60-second interval and suggests setting OTEL_METRIC_EXPORT_INTERVAL=1000 as a safeguard for error paths that might skip the exit flush source. If no metrics appear, confirm that managed configuration has not disabled the metrics pipeline by setting [analytics] enabled = false.
What the dashboard shows
The bundled dashboard includes rolling 24-hour totals for active users, conversation turns, API requests, and token usage. It also provides breakdowns by model, token type, user, department, team, cost center, organization, and session source source. These dimensions let technology leaders distinguish broad adoption from isolated experimentation: an increase in active users across several teams suggests an enablement need, while high consumption concentrated among a small group points to power-user optimization. Tool-call activity reveals where agentic workflows are taking hold, and request-duration metrics support investigation of degraded experiences.
Codex emits several distinct metric types that the dashboard can surface: codex.api_request, codex.api_request.duration_ms, codex.turn.e2e_duration_ms, codex.turn.token_usage, codex.turn.tool.call, codex.thread.started, and codex.conversation.turn.count source. According to the OpenAI Codex documentation, telemetry collection via OTel is not enabled by default; you must explicitly configure separate exporters for logs, metrics, and traces in the Codex settings source.
Governance and privacy trade-offs
Because the dashboard breaks down activity by individual user, the same data that helps engineering directors can raise privacy issues if distributed without controls. For executive summaries, rely on aggregated totals at the team, department, or cost-center level. Reserve per-user drill-downs for authorized system administrators, security analysts, or finance staff, and make sure your access model matches your organization’s employee-monitoring and data-retention rules source.
Keep the number of unique metric series under control as you expand. Enforce consistent naming for organizational attributes, drop dimensions that do not feed a specific business decision, and do not attach project codes or temporary IDs unless you have a plan to store and query them. Remember that CloudWatch charges for OTel metrics by the gigabyte ingested and that PromQL queries bill based on the number of samples scanned, so estimate costs before enabling organization-wide collection source.
The local-collector design gives you visibility and soft guardrails. You can set CloudWatch alarms that trigger Amazon SNS alerts when a team exceeds a predefined usage threshold. The catch is that IAM Identity Center issues short-lived credentials directly to the collector, so this path cannot stop an Amazon Bedrock call mid-request when a budget is exhausted. For synchronous budget enforcement, deploy a gateway that sits in the request path, but weigh the added operational complexity against the identity-tracking benefits source.
While token metrics reveal usage patterns, they should not be treated as an invoice. Published list prices can shift due to negotiated discounts, credits, or billing adjustments that do not appear in raw usage data. To reconcile actual spend, pull IAM principal cost allocation from AWS Cost and Usage Reports (CUR) 2.0 or the dedicated Amazon Bedrock cost-management reports source.
Alternative rollout paths for stricter control
The broader Codex on AWS guidance repository describes three customer rollout paths. If your organization needs hard budgets or centralized routing, the repository outlines a LiteLLM-on-ECS gateway pattern that authenticates developers, applies model and budget policy, obtains upstream AWS credentials, and forwards requests to Bedrock source. That gateway records each Responses API turn with its status, scoped key alias, model, cost, and latency, giving platform teams centralized identity and spend visibility source.
The repository also retains an AgentCore Gateway pattern for customers who specifically need AWS-managed routing, Bedrock Guardrails, or AWS-private web search source. The LiteLLM reference was contract-tested in us-east-1 using a CIDR-restricted HTTP walkthrough, and the health endpoint confirms proxy reachability through an Application Load Balancer source.

The diagram above shows how LiteLLM sits in the request path, adding policy enforcement while Codex remains on the developer machine. This is the trade-off: you gain synchronous budget controls, but you introduce a centralized service that the native OTel pattern deliberately avoids.

The second screenshot shows the browser view of the LiteLLM walkthrough endpoint, confirming that the gateway is reachable and returning responses through the Application Load Balancer. The walkthrough endpoint is CIDR-restricted and intentionally uses HTTP only; production defaults remain TLS and Multi-AZ source.
Rolling out in phases
Begin with a single engineering group whose managers and developers understand why the telemetry is being collected. Confirm that user and team tags map correctly, that the dashboard surfaces questions the group actually asks, and that your access rules align with internal policy source. After that pilot works, introduce a limited set of organizational tags and set up alerts for anomalous patterns. Only then roll out the collector configuration through your standard endpoint-management tooling once you have a repeatable process for updates and support source. Finally, pair CloudWatch usage telemetry with AWS Cost and Usage Report (CUR) 2.0 reporting so leaders can review adoption and operational behavior alongside billing-grade costs source. Phasing the rollout limits upfront spend and allows teams to adjust the tracked dimensions and alert thresholds as they learn which metrics actually drive decisions.
Cleanup
To remove the monitoring pattern, stop the collector on developer workstations and delete the dashboard stack:
aws cloudformation delete-stack \
  --stack-name codex-otel-dashboard \
  --region us-west-2
aws cloudformation wait stack-delete-complete \
  --stack-name codex-otel-dashboard \
  --region us-west-2
If no other workload depends on the account-level enrichment features, evaluate disabling them with aws cloudwatch stop-otel-enrichment and aws observabilityadmin stop-telemetry-enrichment source. Confirm dependencies first, because these settings can support other CloudWatch observability use cases in the account.
Related reading
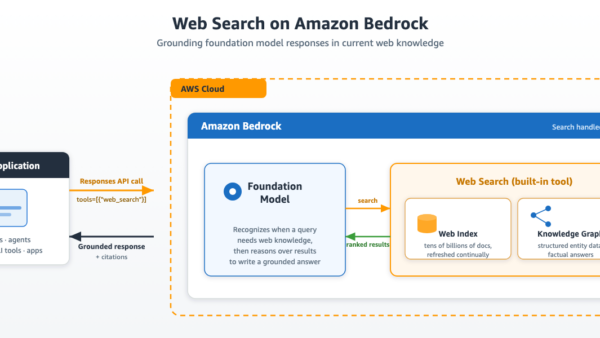
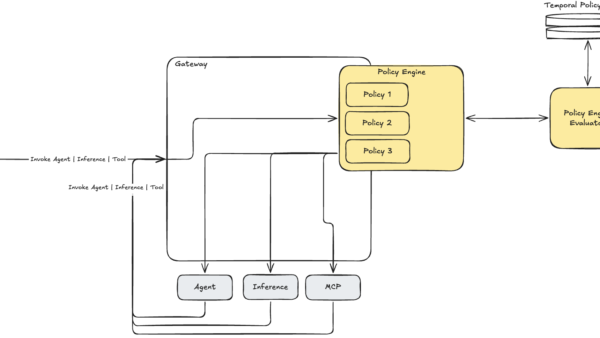
For teams that need to enforce rate limits or temporal policies on AI traffic through Amazon Bedrock, see our guide on securing AI agents with temporal policies in Amazon Bedrock source. If you are evaluating web search grounding for Bedrock models, our earlier walkthrough on enabling web search grounding on Amazon Bedrock source covers the complementary retrieval configuration.