
You can watch what an AI agent actually does — every reasoning step, tool call, and token spent — inside one dashboard even when that agent runs on your own servers, in Google Cloud, or on Azure instead of inside AWS. Amazon Bedrock AgentCore Observability is AWS’s managed tracing and analytics layer for agents, but out of the box it only ingests telemetry from agents deployed on the AgentCore runtime in the AWS Cloud; the capability “natively supports only agents deployed on AgentCore runtime in the AWS Cloud,” so anything running elsewhere needs extra configuration to forward its signals Amazon Web Services explains that limitation in the official walkthrough. This guide shows how to bridge that gap with the AWS Distro for OpenTelemetry (ADOT) so a Strands, LangGraph, or CrewAI agent running outside AWS shows up in the same CloudWatch-powered observability dashboard as a runtime-hosted agent.
What you need before you start
Confirm a few things on the AWS side first. You need an AWS account with Amazon Bedrock model access configured — the walkthrough uses Anthropic’s Claude Haiku 4.5 model, referenced as us.anthropic.claude-haiku-4-5-20251001-v1:0 in the us-east-1 region the official walkthrough lists these exact prerequisites and the model ID. You also need CloudWatch Transaction Search turned on once per account, Python 3.10 or later on the non-AWS machine, and an IAM user with a specific permission set: bedrock:InvokeModel, logs:CreateLogGroup, logs:CreateLogStream, logs:PutLogEvents, the X-Ray permissions xray:PutTraceSegments/xray:PutTelemetryRecords/xray:GetSamplingRules/xray:GetSamplingTargets, and cloudwatch:PutMetricData the same walkthrough enumerates those IAM actions as the minimum for exporting telemetry. Finally, the environment must allow outbound HTTPS to AWS endpoints.
One-time: turn on CloudWatch Transaction Search
Run the following once per account to route trace segments into CloudWatch Logs:
aws xray update-trace-segment-destination --destination CloudWatchLogs --region us-east-1
Then verify it is active:
aws xray get-trace-segment-destination --region us-east-1
# Expected: {"Destination": "CloudWatchLogs", "Status": "ACTIVE"}
AWS documents the Transaction Search activation as a one-time per-account step.
How the pipeline fits together
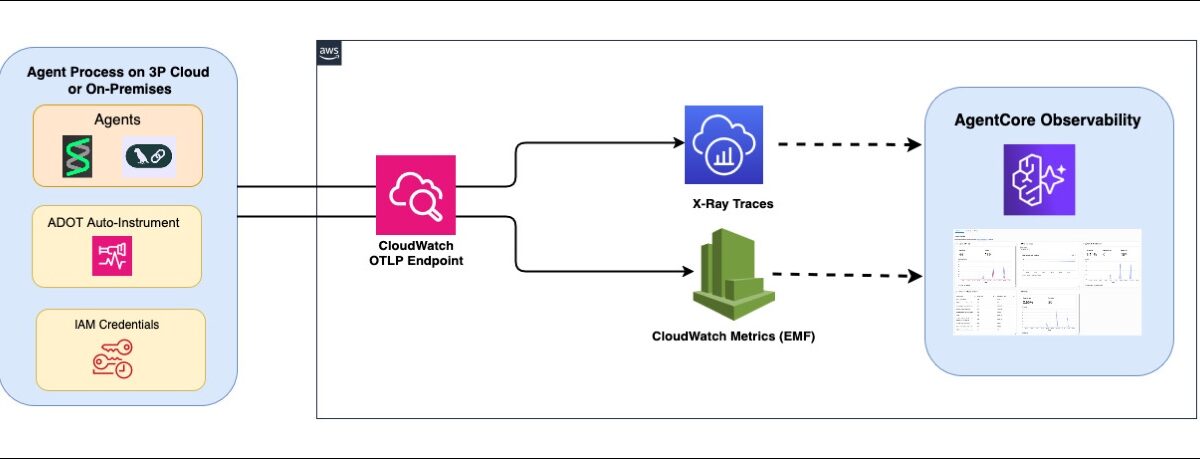
The bridge has three moving parts. The AWS Distro for OpenTelemetry runs in-process with your agent application and auto-instruments the framework, capturing spans that follow the OpenTelemetry generative AI semantic conventions — agent reasoning steps, tool invocations, and model calls with token usage. Those spans are exported to the CloudWatch native OTLP ingestion endpoint using SigV4 authentication signed with your IAM credentials. CloudWatch stores and indexes the telemetry, and AgentCore Observability renders it as specialized dashboards. The diagram below shows the end-to-end flow from an on-premises or third-party-cloud agent into the AgentCore Observability dashboard.
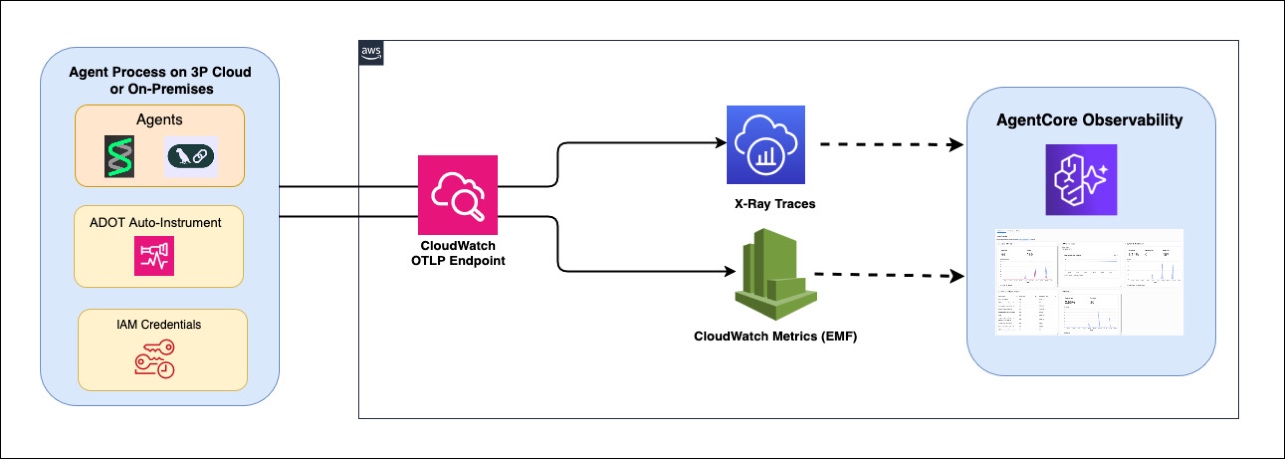
Source: AWS Machine Learning — Monitor on-premises and multi-cloud AI agents with AgentCore Observability
AgentCore itself is framework- and model-agnostic: its overview states it works with open-source frameworks such as CrewAI, LangGraph, LlamaIndex, and Strands Agents and with any foundation model, so you are not locked into a single stack when you adopt this observability pattern Amazon Bedrock AgentCore’s overview confirms support for those frameworks and any model. If your agents already run on the AgentCore runtime, this whole setup is unnecessary — the steps below are specifically for the outside-AWS case, which complements patterns like bridging runtime agents to local tools see how a runtime-hosted agent can reach local MCP tools.
Step 1: Install the instrumentation packages
On the non-AWS environment (an on-prem server, a GCP VM, an Azure VM, or any machine with internet access), install the dependencies:
pip install "aws-opentelemetry-distro>=0.10.0" boto3 "strands-agents[otel]"
The aws-opentelemetry-distro package ships the ADOT auto-instrumentation with AWS-specific OTLP exporters and the aws_configurator that handles SigV4 authentication, while strands-agents[otel] emits OpenTelemetry traces from the Strands framework the walkthrough pins aws-opentelemetry-distro>=0.10.0 and the strands OTel extra as the install step.
Step 2: Configure AWS credentials
Export your IAM user credentials as environment variables:
export AWS_ACCESS_KEY_ID=<your-...-id>
export AWS_SECRET_ACCESS_KEY=<your-...key>
export AWS_REGION=us-east-1
For production, prefer IAM Roles Anywhere over long-lived keys so on-premises workloads obtain temporary credentials via X.509 certificates AWS recommends IAM Roles Anywhere for production external workloads in the walkthrough’s security note.
Step 3: Set the OpenTelemetry environment variables
These variables tell ADOT where to route and how to authenticate the telemetry:
export AGENT_OBSERVABILITY_ENABLED=true
export OTEL_PYTHON_DISTRO=aws_distro
export OTEL_PYTHON_CONFIGURATOR=aws_configurator
export OTEL_RESOURCE_ATTRIBUTES="service.name=my-external-agent,aws.log.group.names=/aws/bedrock-agentcore/runtimes/my-external-agent"
export OTEL_EXPORTER_OTLP_LOGS_HEADERS="x-aws-log-group=/aws/bedrock-agentcore/runtimes/my-external-agent,x-aws-log-stream=runtime-logs,x-aws-metric-namespace=bedrock-agentcore"
export OTEL_EXPORTER_OTLP_PROTOCOL=http/protobuf
export OTEL_TRACES_EXPORTER=otlp
AGENT_OBSERVABILITY_ENABLED=true switches on generative-AI-specific telemetry processing inside ADOT. OTEL_PYTHON_DISTRO=aws_distro and OTEL_PYTHON_CONFIGURATOR=aws_configurator enable AWS-specific configuration including SigV4 signing for the CloudWatch OTLP endpoint. Most importantly, OTEL_RESOURCE_ATTRIBUTES with aws.log.group.names is what makes CloudWatch index the telemetry under the AgentCore Observability dashboard — without it, traces fall back to generic CloudWatch Logs — and OTEL_EXPORTER_OTLP_LOGS_HEADERS with x-aws-metric-namespace=bedrock-agentcore routes metrics in embedded metric format to the right namespace the walkthrough details each of these environment variables and their routing effect. Setting OTEL_EXPORTER_OTLP_PROTOCOL=http/protobuf selects the OTLP/HTTP transport instead of gRPC, which is what the CloudWatch native OTLP ingestion endpoint expects; the exact endpoint URL is derived from your region and is documented under the CloudWatch OTLP endpoint configuration AWS documents how the CloudWatch OTLP endpoint URL is determined and configured.
Step 4: Create the agent application
Write a file named agent_test.py that builds a Strands agent backed by Bedrock:
from strands import Agent
from strands.models.bedrock import BedrockModel
from opentelemetry import baggage
from opentelemetry.context import attach
import time

model = BedrockModel(
    model_id="us.anthropic.claude-haiku-4-5-20251001-v1:0",
    region_name="us-east-1"
)
agent = Agent(model=model, system_prompt="You are a helpful travel assistant.")
session_id = f"external-session-{int(time.time())}"
ctx = baggage.set_baggage("session.id", session_id)
attach(ctx)
response = agent("What are the top 3 things to do in Tokyo?")
print(response)
The session.id baggage value lets AgentCore track the session across multiple requests and responses the official sample sets session.id so the dashboard groups the agent’s calls into one session.
Step 5: Run with ADOT auto-instrumentation
Wrap the process with the OpenTelemetry auto-instrumentation command instead of calling Python directly:
opentelemetry-instrument python3.12 agent_test.py
The opentelemetry-instrument launcher injects ADOT into the Python runtime, automatically patching boto3 (for Bedrock calls) and the Strands framework (for reasoning spans) so they emit OpenTelemetry traces without code changes AWS describes opentelemetry-instrument as the wrapper that auto-patches boto3 and Strands. The agent’s answer prints to the terminal while, behind the scenes, ADOT captures and exports traces, spans, and logs to CloudWatch.
Step 6: Verify in AgentCore Observability
Telemetry appears within two to three minutes of execution the walkthrough states you see data within two to three minutes of running the agent. Open the CloudWatch console, choose GenAI Observability, then Bedrock AgentCore, and find my-external-agent under the Agents tab. The dashboard shows the agent name, at least one session, trace spans for the agent’s reasoning and Bedrock invocations, and span details such as invoke_agent, chat, execute_event_loop_cycle, and chat.us.anthropic.claude-haiku with latency and token metrics.
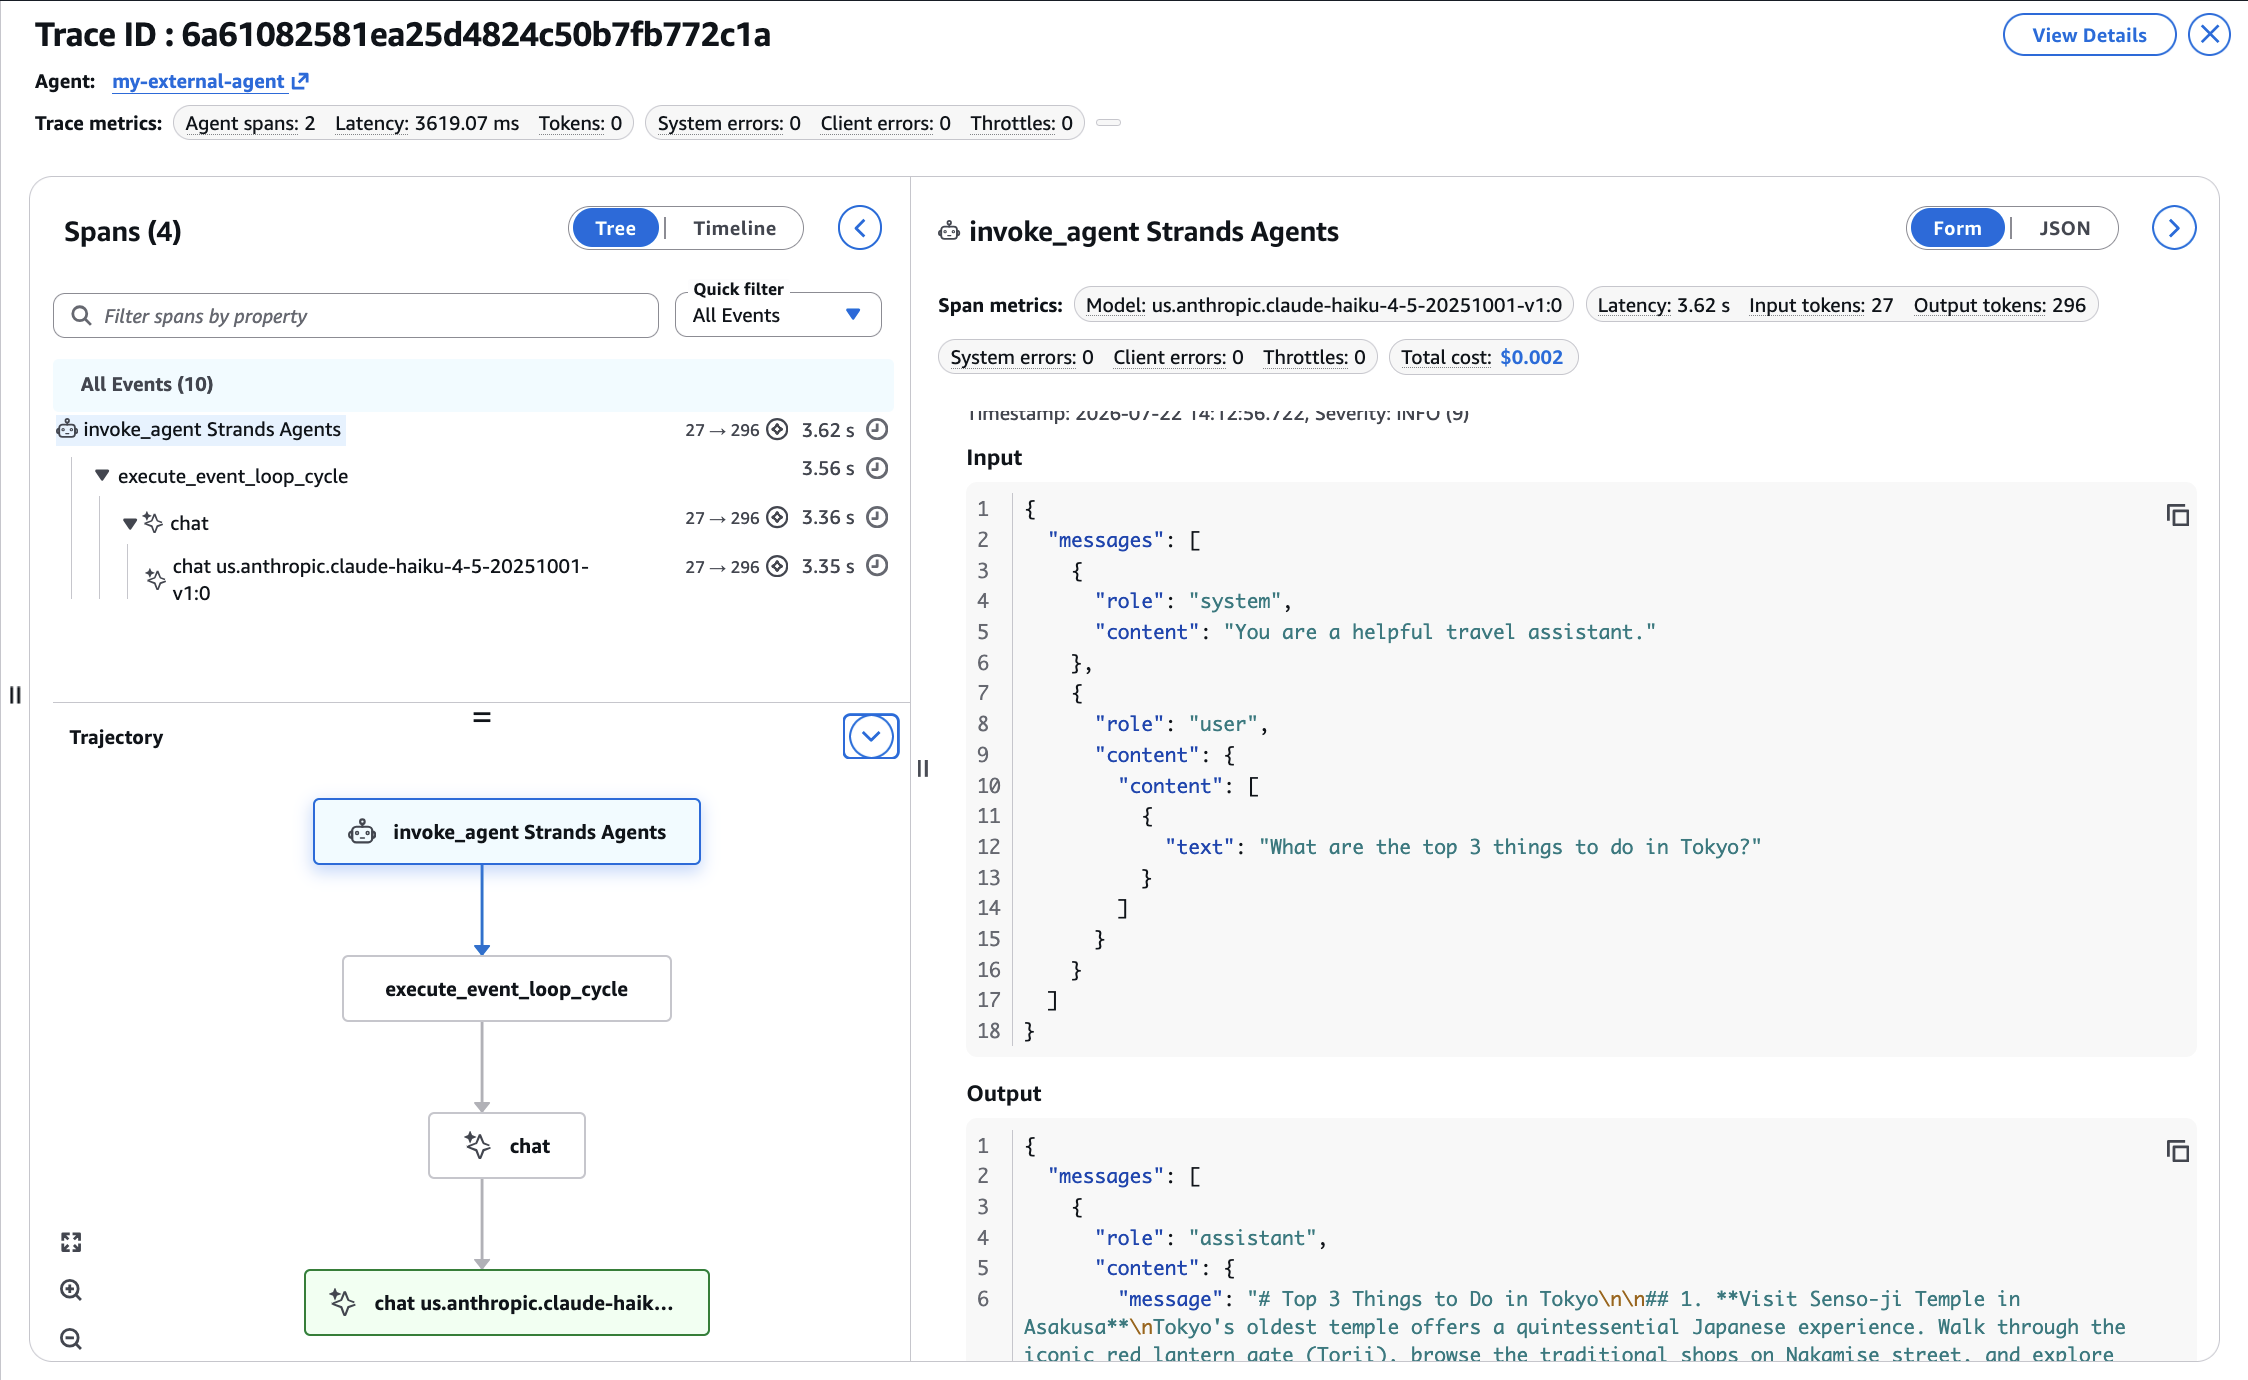
Source: AWS Machine Learning — Monitor on-premises and multi-cloud AI agents with AgentCore Observability
Source: AWS Machine Learning — Monitor on-premises and multi-cloud AI agents with AgentCore Observability
Confirm it works from another cloud
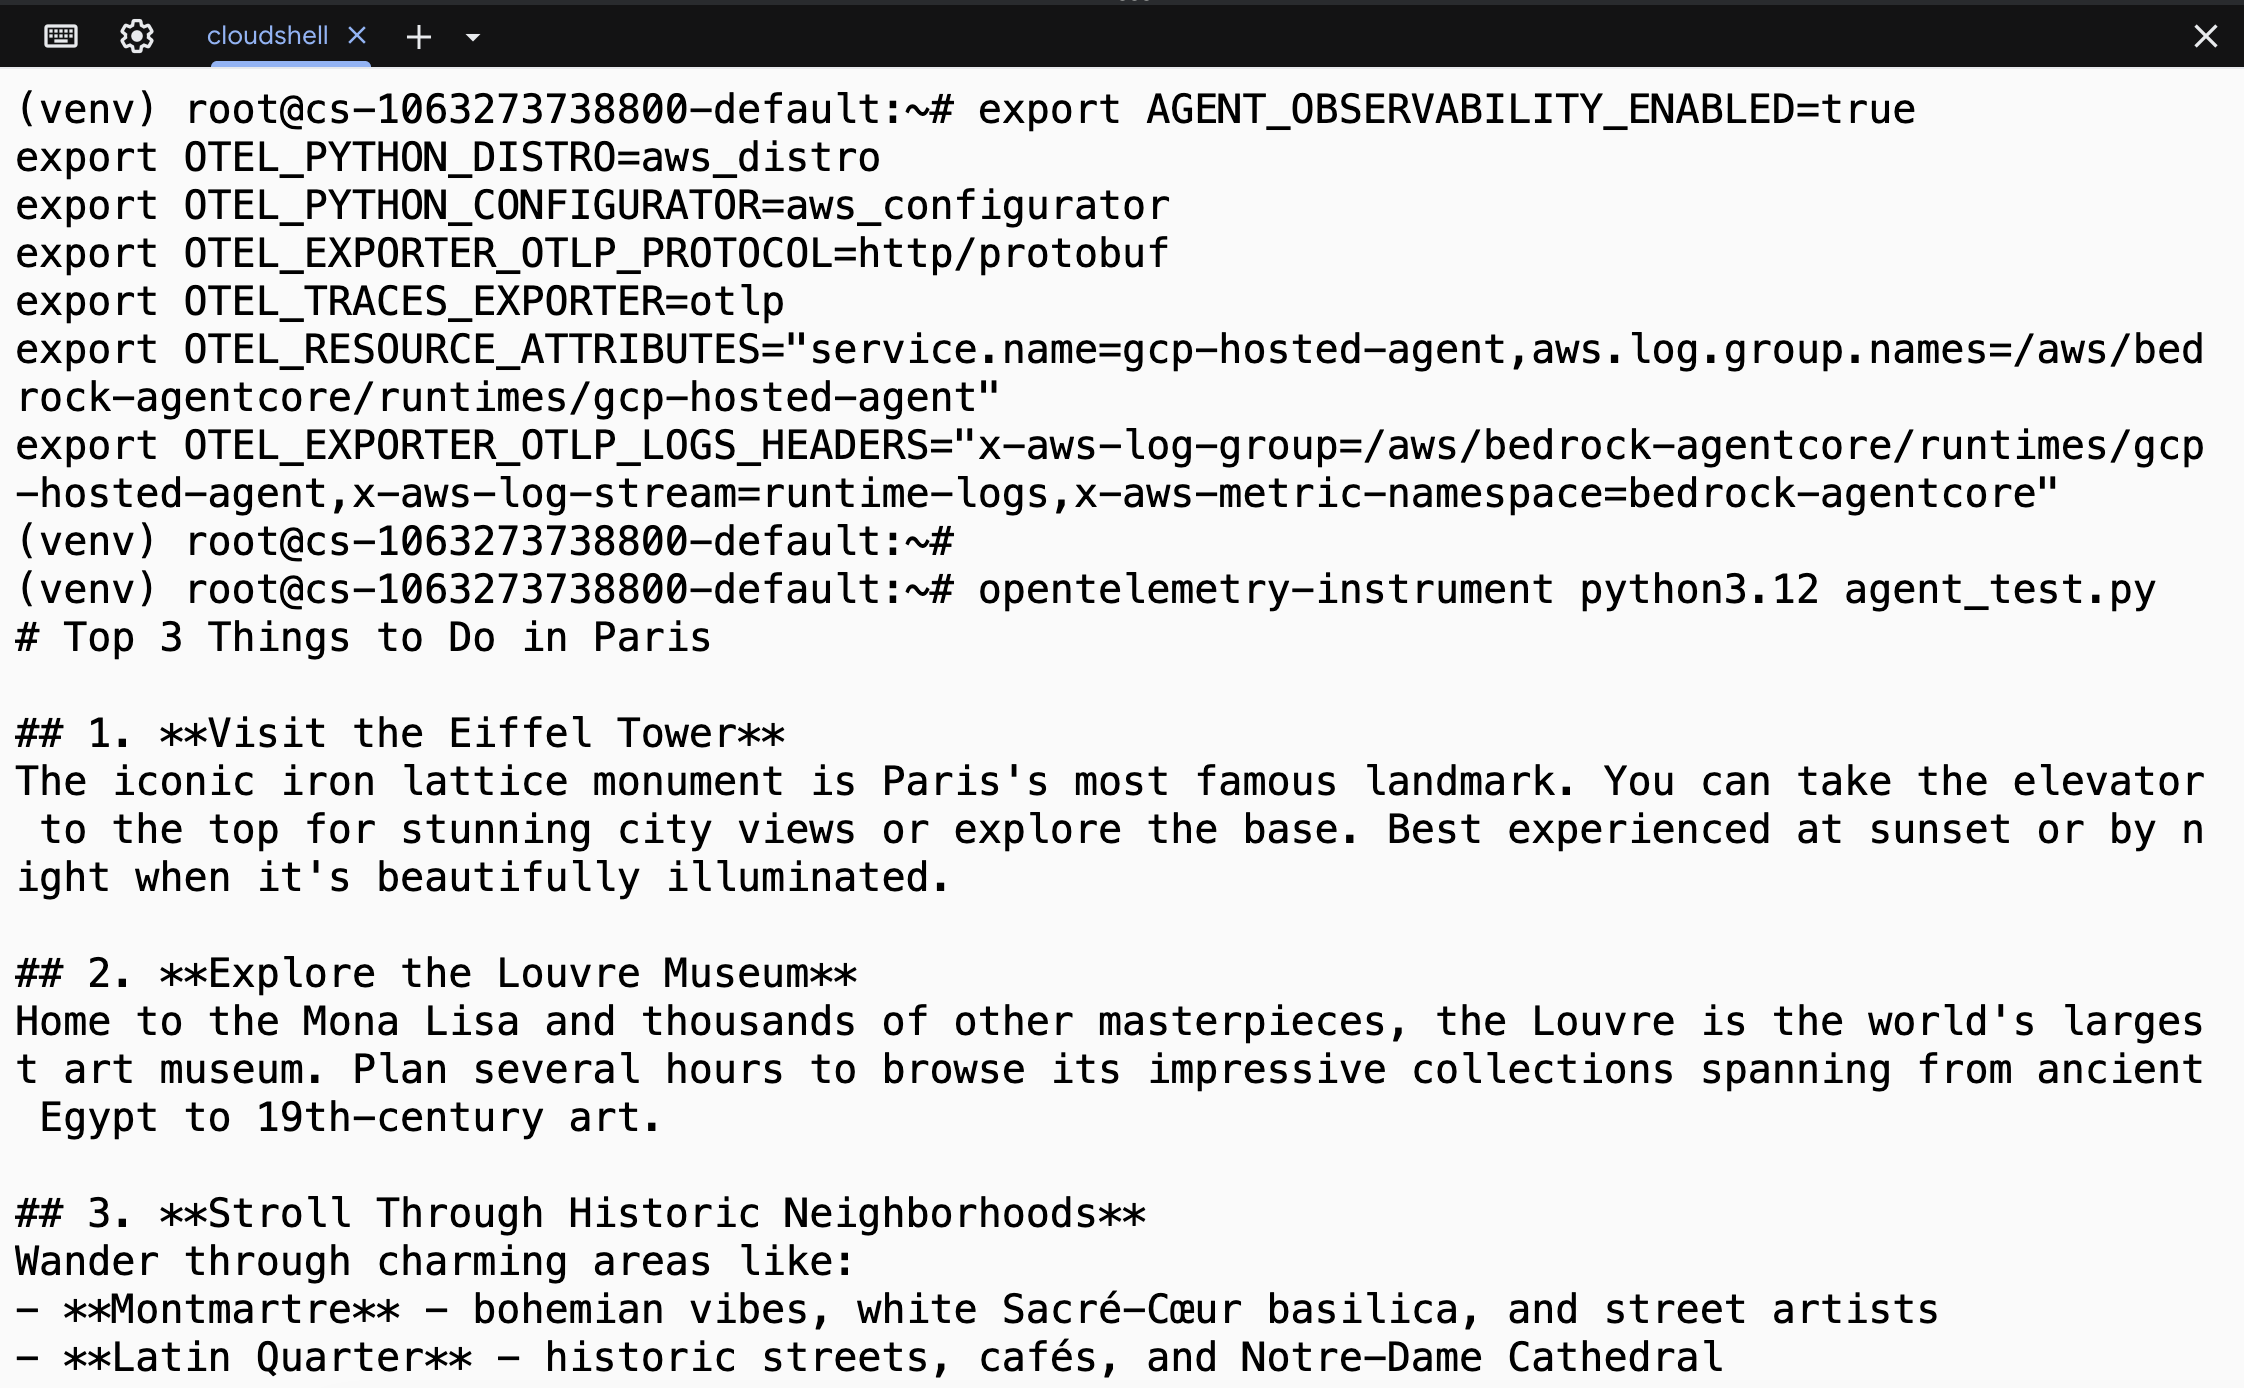
To prove the pattern is truly cloud-agnostic, the same setup was run from Google Cloud Shell, a browser terminal on GCP infrastructure. The commands are identical except for the service.name and log group name (gcp-hosted-agent). Within two to three minutes the gcp-hosted-agent shows up in the same AgentCore Observability dashboard as the on-prem agent, with identical sessions, traces, span metrics, token usage, and latency AWS validated the cross-cloud path from Google Cloud Shell and reports identical telemetry to a runtime-hosted agent. This is the same ADOT-based approach regardless of framework, so a LangGraph or CrewAI agent follows the identical variable layout.
Why the telemetry matters
AgentCore Observability gives real-time visibility into operational performance through CloudWatch-powered dashboards that surface key metrics such as session count, latency, duration, token usage, and error rates AgentCore Observability’s documentation lists session count, latency, duration, token usage, and error rates as key built-in metrics. On top of those, the walkthrough highlights that routing telemetry to AgentCore lets you inspect reasoning chains, tool invocations, and model outputs so you can detect hallucinations, catch harmful or off-topic responses, track token usage for cost governance, and audit behavior across every environment — which is especially important for agents running outside AWS, where problematic outputs might otherwise go unnoticed the walkthrough frames observability as a pillar of responsible AI for exactly these cross-environment risks. If you run agents at scale, combining this telemetry with an orchestration layer such as n8n keeps cost and quality visible in one place one pattern runs production agents in n8n on Amazon Bedrock AgentCore.
Wrap-up
With six configuration steps you can make any OpenTelemetry-compatible agent — on bare metal, in a corporate data center, or on a competing cloud — report into the same AgentCore Observability dashboard as a native runtime agent. The entire bridge is the AWS Distro for OpenTelemetry plus a handful of environment variables; no agent code changes beyond wrapping the launch command. Once the signals land in CloudWatch, you get one consistent place to debug reasoning, watch token spend, and audit behavior wherever the agent actually runs.
Editorial note: Citation cleanup: we trimmed duplicate citation links that repeated the same source after multiple paragraphs. Every fact and quote is unchanged; the source remains cited where each claim appears.